-
Archive - 2023

A contrarian’s views on Real Estate Stocks
 Anil Sarin
Executive & CIO Centrum PMS
#UHNI #WealthManagement
Anil Sarin
Executive & CIO Centrum PMS
#UHNI #WealthManagement
Ask any investor to describe his ideal investment scenario and he would very likely paint the following landscape – revenue growth should be healthy, valuation should not be expensive, competitive intensity should be low and a long upcycle should be just beginning. This is what a dream scenario looks like. Under these conditions, investors can comfortably deploy large amounts of capital, without fearing losses in the medium term. They can even increase their capital outlay over time as confidence increases due to results repeatedly meeting their expectations. We believe such a scenario exists – in the shape and form of real estate stocks. After a ~8-year long down cycle, Indian residential real estate market has turned the corner. Unsold inventory is at multi year lows, registrations of home purchase are booming and new home bookings are strong. But bulk of the growth is concentrated amongst a few large and branded players. This cohort has grown its new home bookings at an annualized rate of 33% during the period FY20 to FY22, and 9 month FY23 data indicates continuation of this healthy trend.
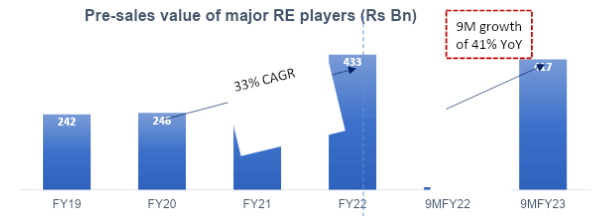
Source: Company, Centrum. Note: The graph includes pre-sales of major 7 listed developers viz. Godrej Properties, DLF, Oberoi, Macrotech, Sobha, Brigade & Prestige.
Making and selling residential homes is a profitable business; long term project level returns are in the range of 20-23% (IRR). But at current prices, valuation of most RE stocks does not adequately discount their strong medium term revenue growth and robust profitability. We’re convinced this will change. Combination of rising earnings and rising valuation will lead to attractive returns.
Before we move further, some history is in order. The RE industry (making and selling residential homes) of the early 2000s was a bit like the wild west, with hundreds of players catering to strong demand being driven by the twin drivers of rapid urbanization and massive cash dealings. Consistently rising real estate prices gave the impression of RE being a ‘safe’ investment, and soon even tax paying ‘cheque-based’ buyers started speculating in housing projects. Indian RE thus became an ‘asset class’, with three growth drivers. Strong demand by cash based and cheque based investors kept driving RE prices higher and higher even after Indian economy started slowing in the early 2010s. By ~2013, the inventory of unsold houses had become very large, and prices of houses became too rich for a slowing economy to absorb. Money became tight and construction activity slowed. The much delayed regulation of RE industry was promulgated as RERA in June 2016, which was quickly followed by Demonetization, and then by GST. Excess inventory, slowing sales and curbs on cash dealings led to a brutal shake out in the industry, with only a handful of players surviving.
What is different now? Why will the party continue for next 4-5 years? Unlike the past, the RE industry is now well regulated and leading players have strong balance sheets. The average Net Debt to Equity ratio of prominent Resi RE companies is only ~0.5x with interest rates very competitive for major developers. Note that this debt includes loans for asset-heavy commercial real estate projects. Overhang of excess inventory is gone, while urbanization continues to expand. Home loan interest EMIs are much lower now, when adjusted for the increase in average take-home salaries. Families are growing more nuclear, leading to demand. There is also a desire to own larger houses amongst upwardly mobile city dwellers.
These are the sources of DEMAND; what about SUPPLY? This is where the opportunity lies! The savage consolidation of recent years. According to RE research firm PropEquity, over the past 8 years roughly 75% of developers have perished in NCR, Chennai and Bangalore region. This has led to barely 30-40 reputable developers being left alive. These survivors meet all the success conditions of brand, balance sheet, execution and sales engine. It’s a classic bull market set-up, with strong demand and weaker supply leading to ‘pricing power’. As Charlie Munger once said “If you have a business that has pricing power and if you have a business that can pass on cost increases, then that’s a good business to own”.
What are the entry barriers, or moats enjoyed by listed RE players? The biggest moat is Trust. This got built when a few players delivered housing apartments as promised, while the vast majority of developers could not or did not. Trust leads to access to ‘other people’s money’, or ‘OPM’. Players with access to OPM enjoy a decisive advantage over other developers who have to fund the project from their own balance sheet. Access to interest free OPM leads to higher RoE per project, which the stock market likes. It also enables trusted players to undertake bigger and higher profile projects than non-trusted players even when the balance sheet size is same for both. As this process of higher RoE and higher profile projects plays out over time, trusted players will become far bigger and achieve dominance. This is already leading to brand premium and enhanced funding / collaboration opportunities.
The market likes the notion of ‘unorganized to organized’. This theme has led to great stock ideas in industries like Cinema Exhibition, Retail, Paints, Building Materials, Luggage etc. We contend that RE industry is also seeing unorganized to organized transition, but at much greater speed and scale. Rapidly rising revenue and strong profitability should lead to healthy valuation ratios for high quality RE players.
Let’s look at the ‘pre sales’ performance of top rated RE stocks (the survivors). The table shows robust sales momentum in last four years FY19 to FY22.
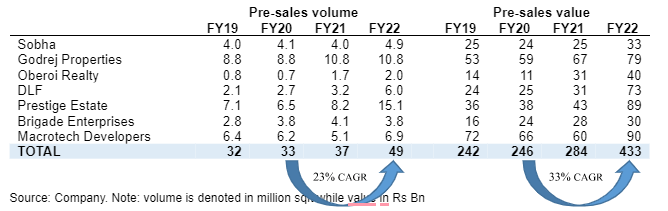
One might dismiss the above as ‘pent up’ demand or ‘catch up’ phase. What about the period beyond FY22? As already mentioned, in the first 9 months of FY23, pre sales value has grown by 33%. Some may argue that the numbers presented above are merely bookings. But the trend of cash collections, which mimic the pace of execution is very strong and we feel reassured that the ‘pre-sales’ bookings are successfully converting into actual revenue.
However, despite strong upside potential, RE stocks are not hot favorites amongst investors. We can think of the following reasons:
First off, this industry is just emerging from a painful period of losses and insolvencies. Investors are waiting and watching since there’s no legacy of this industry having made money for investors in the past. Most RE stocks got listed either at the fag- end of 2003-2008 bull run or thereafter.
Second, unlike regular companies, RE companies account for sales and profits only when flats are handed over to ultimate owners. Direct expenses associated with a project are reflected on the balance sheet as Work in Progress inventory until the project is completed, at which point revenues and profits are recognized. Indirect expenses and overheads (other than those apportioned to project), on the other hand, are recognized immediately. This creates a discrepancy between upfront expenses and back-ended revenues and profits, which can be misleading when evaluating a company’s ‘reported’ financials. Common investors are left unimpressed with the reported numbers, although cash is being collected with each milestone completion. A similar misunderstanding played out in early 2000s when banking stocks were initially valued based on P/E ratio, and only later did investors start using Price/Book ratio as key valuation metric. In the event, early investors who studied banking stocks with the right framework made strong returns. We feel a similar story will play out with early investors who focus on cash flow instead of RE companies.
Third, RE is a cyclical industry. Investors hesitate to give lofty multiples to earnings as they feel these might change drastically in coming years. In this respect RE industry is quite similar to the Auto industry, with an important difference that RE has much longer cycles. We feel that just as investors got comfortable with giving higher multiples to high quality Auto players, top rated RE stocks would also see their valuation multiples rise over time.
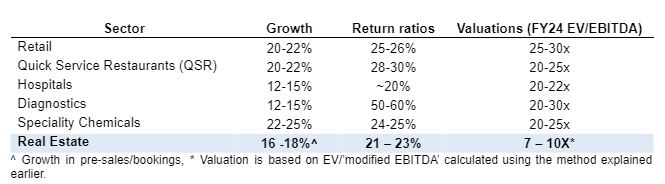
Market preference aside, operating characteristics of RE companies are quite attractive. Typical project level return ratios (after accounting for initial outflows, OPM and later inflows) are in the range of 20-22% annualized. Accounting rules prohibit booking of a sale until full completion and certification, as such RE players declare ‘pre-sales’ on booking of a flat. And as mentioned before, ‘pre-sales’ growth is quite healthy at plus 30%. While this will surely moderate with a rising base, 16-18% sales growth can be comfortably assumed. RE industry also includes commercial offices and retail malls, each of which has a strong growth impulse. All three segments taken together have a long of runway of growth. We believe high growth, strong profitability and high entry barriers is a potent combination.
Regulations typically lead to re-rating
Regulation and / or consolidation in a sector usually heralds a new dawn, with the survivors enjoying healthy profitability and growth as the sector revives. This was seen in the case with Microfinance industry in 2013 (SKS/Bharat Finance and many other MFIs), Gold finance norms relaxation in 2014 (Muthoot and Manappuram) and more generally in the Steel and Cement industries after long consolidation of those sectors. The same is playing out in the RE industry as well, with leading resi. RE companies showcasing healthy cash accretion and strong margins, announcing aggressive growth plans.
How to value RE stocks?
RE company revenue is booked only on handing over of the property, not on ‘percentage completion’. Until then, it sits in the balance sheet as ‘work-in-process’ inventory. As such in the initial years, project margins appear depressed and working capital seems inflated. This conveys a misleading and negative picture. Thoughtful investors use an assumed percentage completion method for deriving the ‘modified’ EBITDA and compare it as a ratio with the company’s enterprise value. As the apartment/flat bookings are announced by RE players, the ‘revenue’ and associated costs are apportioned over the years based on percentage completion of the project, and a ‘modified EBITDA’ is derived, using the trend of past profitability. This results in a ‘modified’ EV/EBITDA multiple. This makes RE stock valuation comparable to valuation of ‘regular’ stocks.
For instance – let’s take a project with revenue potential of Rs100 cr, to be constructed & sold over 4 years, with potential EBITDA margin of ~20%. The cash flow will be negative in the first year, followed by steady cash inflows for the next 3 years. While reported EBITDA will be mostly negative, ‘modified EBITDA’ will be positive, spread across the project period. In reality there would be multiple projects running concurrently, and reported EBITDA will depend on maturity profile of different ongoing projects. Modified EBITDA remains positive and well spread out, due to milestone-based cash collections. Investors need to focus on the modified EBITDA to get a firm grip on business economics. Just like banking stocks are best evaluated using book value growth and multiples, RE stocks are best evaluated using growth and margins of modified EBITDA.
This brings us to the most interesting part. Indian investors have historically given lofty multiples to industries that have strong growth and profitability. If the industry falls within a larger narrative like ‘China + one’, ‘unorganized to organized’ etc. then valuation multiples go even higher. Hence we see Speciality chemicals, Retail, Cinema Exhibition and Luggage stocks trading at lofty valuations. But due to vagaries of Indian accounting norms, RE stocks offering a long period of above- average growth, attractive return on capital and relatively high barriers to entry (Moat), trade at modest multiples.
Debunking some Myths
Given its short history, there are a lot of misunderstandings around the Resi RE stocks. We attempt some clarifications below:
Myth 1 – RE stocks should trade as per their net asset value (NAV), which is the net value of all their aggregated projects. Since this NAV is realized after 4-5 years, investors need to compute the Net Present Value (NPV) of this value. NPV is computed using a discount rate which is roughly equivalent to interest rates. With rising interest rates, RE stock’s NPV would come down, hence their share prices should be market down. Our answer – While accounting revenue is booked on completion of project, the cash is received on milestone completion during the life of the projects. As such there is very little money remaining to be collected at end of project. Therefore, NPV calculation and its link to interest rate is relevant only for future projects and for the land bank that an RE company carries. NAV based approach also ignores future projects, which is at odds with the ‘terminal value’ concept of valuation.
Myth 2 – Too much supply is coming, prices will fall. Our answer – Real Estate prices typically not determined by supply and demand, but rather by the buildup of unsold inventory. In order for prices to drop, there must be a significant surplus of unsold properties in the market. Currently, the level of unsold inventory is at a 10-year low of around 20-22 months, compared to a peak of approximately 40 months in mid-2017. Recent demand has been strong, and developers are quite disciplined.
Myth 3 – Rising interest rates will reduce attractiveness of residential RE, and will kill the rally in RE stocks. Our Answer – While higher interest rates may affect Real Estate valuation, their impact on pre sales growth has been limited thus far (evidenced by recent 9M pre-sales momentum). Even after a 250 bps rate hikes over last 11 months which has taken home loan rates to 9.5%, rates are only slightly higher than pre-COVID levels of 8.5-9%. Interest rate movements have greater impact on long-term projects such as Commercial Real Estate, rather than Residential Real Estate. We believe rate hike cycle is nearing its peak and hence the already limited impact of interest rate movement on RE stocks should taper off as the demand continues to remain strong.
Experienced investors know that the best returns are made when there is a wide disconnect between attractive fundamentals and poor investor perception. During 2003-2007 road and bridge making EPC companies delivered shareholder returns in multiples of FMCG stocks. Similarly, investors who caught on Speciality Chemicals in FY16 did much better than the market in the following years. We think RE stocks are similarly placed.
One last point – while there is a common perception that real estate stocks are not popular with investors, a cursory look at FII and MF holdings of RE stocks would reveal that roughly 350 institutional investors own ~80% of free float of most RE stocks. Smart money has already moved in, it’s time for retail investors to re-evaluate their perceptions.
RE players offer double digit growth, 20%+ EBITDAM, 20%+ project IRRs, market share gains and a strong moat (brand). At ~9-10x FY24 EV/modified EBITDA, the sector offers an attractive investment opportunity.